Central Dicer-miR-103/107 controls developmental switch of POMC progenitors into NPY neurons and impacts glucose homeostasis
- Children’s Hospital Los Angeles, United States
- University of Southern California, California
- Inserm U1172, Lille 2 University of Health and Law, France
Abstract
Proopiomelanocortin (POMC) neurons are major negative regulators of energy balance. A distinct developmental property of POMC neurons is that they can adopt an orexigenic neuropeptide Y (NPY) phenotype. However, the mechanisms underlying the differentiation of Pomc progenitors remain unknown. Here, we show that the loss of the microRNA (miRNA)-processing enzyme Dicer in POMC neurons causes metabolic defects, an age-dependent decline in the number of PomcmRNA-expressing cells, and an increased proportion of Pomc progenitors acquiring a NPY phenotype. miRNome microarray screening further identified miR-103/107 as candidates that may be involved in the maturation of Pomc progenitors. In vitro inhibition of miR-103/107 causes a reduction in the number of Pomc-expressing cells and increases the proportion of Pomc progenitors differentiating into NPY neurons. Moreover, in utero silencing of miR-103/107 causes perturbations in glucose homeostasis. Together, these data suggest a role for prenatal miR-103/107 in the maturation of Pomc progenitors and glucose homeostasis.
https://doi.org/10.7554/eLife.40429.001Introduction
The growing prevalence of obesity is a major health concern, particularly among children. Recent evidence has shown that obesity and associated diseases, such as type II diabetes, might be a consequence of alterations in the developmental processes of a variety of systems involved in energy balance regulation, including the hypothalamic melanocortin system (for review see (Bouret et al., 2015; Ralevski and Horvath, 2015; Steculorum et al., 2013). An important component of this system includes pro-opiomelanocortin (POMC) neurons and neurons co-expressing agouti-related protein (AgRP) and neuropeptide Y (NPY) in the arcuate nucleus of the hypothalamus (ARH) (Gautron et al., 2015; Koch and Horvath, 2014). POMC neurons reduce food intake and increase energy expenditure by releasing α-melanocyte-stimulating hormone (αMSH), a product of POMC processing that activates melanocortin-4 receptors (MC4R) (Cone, 2006; Koch and Horvath, 2014). AgRP acts as an endogenous inverse agonist of MC4R.
The developmental processes that produce POMC neuronal pathways can be divided into two broad categories: the determination of cell numbers, which involves neurogenesis, neuron migration, and the determination of neuronal phenotype, and the formation of functional circuits, which includes axon growth and synaptogenesis (see (Markakis, 2002; Coupe and Bouret, 2013) for review). Birthdating studies in rodents indicate that POMC neurons in the ARH are generated primarily on embryonic day (E) 11-E12 and acquire their terminal peptidergic phenotype during mid-gestation (Padilla et al., 2010). Remarkably, cell lineage tracing strategies showed that a subpopulation of embryonic Pomc-expressing precursors can differentiate into NPY neurons (Padilla et al., 2010). A second important developmental period occurs during the first few weeks of postnatal life when POMC neurons send axonal projections to their target sites. The development of axonal projections from the ARH (including αMSH-containing projections) to each of their target nuclei is not initiated until the first week of postnatal life, and these projections are not fully mature until weaning in mice (Bouret et al., 2004a).
The process of developing highly specialized cellular structures, such as POMC neurons, requires the tight temporal and regional regulation of expression for specific sets of genes. However, the molecular mechanisms underlying POMC neuronal development still remain elusive. MicroRNAs (miRNAs) have recently emerged as critical regulators of brain development. These non-coding small endogenous RNA molecules have important functions in gene regulation. They bind to complementary sequences on protein-coding mRNAs and consequently direct their degradation and/or repress their translation (Bartel, 2009). miRNAs exhibit cell- and tissue-specific and developmental stage-specific expression (Lagos-Quintana et al., 2002). They play important roles in a variety of biological programs, including neuronal differentiation, neuronal survival, axon growth, synaptogenesis and other developmental processes (Stefani and Slack, 2008). Dicer is one of the essential enzyme for miRNA maturation (Fineberg et al., 2009). Dicer ablation in various specific populations of neurons has been shown to impair cell fate specification, cause neuronal cell death, and disrupt axon growth (Fineberg et al., 2009; Vo et al., 2010).
Although recent advances have indicated that miRNAs are important regulators of neural development, the role of these non-coding small endogenous RNA molecules in the development of neural systems involved in energy balance regulation remains unclear. In the present study, we investigated the role of miRNAs in the phenotypic differentiation of Pomc progenitors. Our findings revealed that miRNAs are essential for survival and timely maturation of POMC neurons and that loss of Dicer favors the differentiation of Pomc-expressing progenitor cells into NPY neurons and causes metabolic perturbations. We also showed that miR-103/107 play a particularly important role in these processes.
Results
Loss of Dicer in POMC neurons causes metabolic dysregulation
To examine whether miRNAs play a role in hypothalamic development, we first measured Dicer mRNA expression, an essential enzyme for miRNA maturation (Fineberg et al., 2009), in the embryonic, postnatal and adult hypothalamus. The highest levels of Dicer mRNA were found in hypothalamus of mice at embryonic day (E) 14 and 16, supporting a role for miRNAs in embryonic hypothalamic development (Figure 1a). Dicer mRNA levels decreased at postnatal day (P) 10 and the lowest levels of Dicer mRNA were found in the hypothalamus of adult mice (Figure 1a). We next assessed Dicer mRNA expression specifically in POMC neurons and found that Dicer mRNA was expressed in isolated POMC neurons as early as at E13-E15, that is when Pomc progenitor cells differentiate to either POMC or NPY neurons (Figure 1b). Notably, Dicer mRNA was also highly expressed in NPY neurons at E15 (Figure 1b).
Figure 1 with 1 supplement see all
Loss of Dicer in Pomc expressing neurons causes metabolic dysregulation.
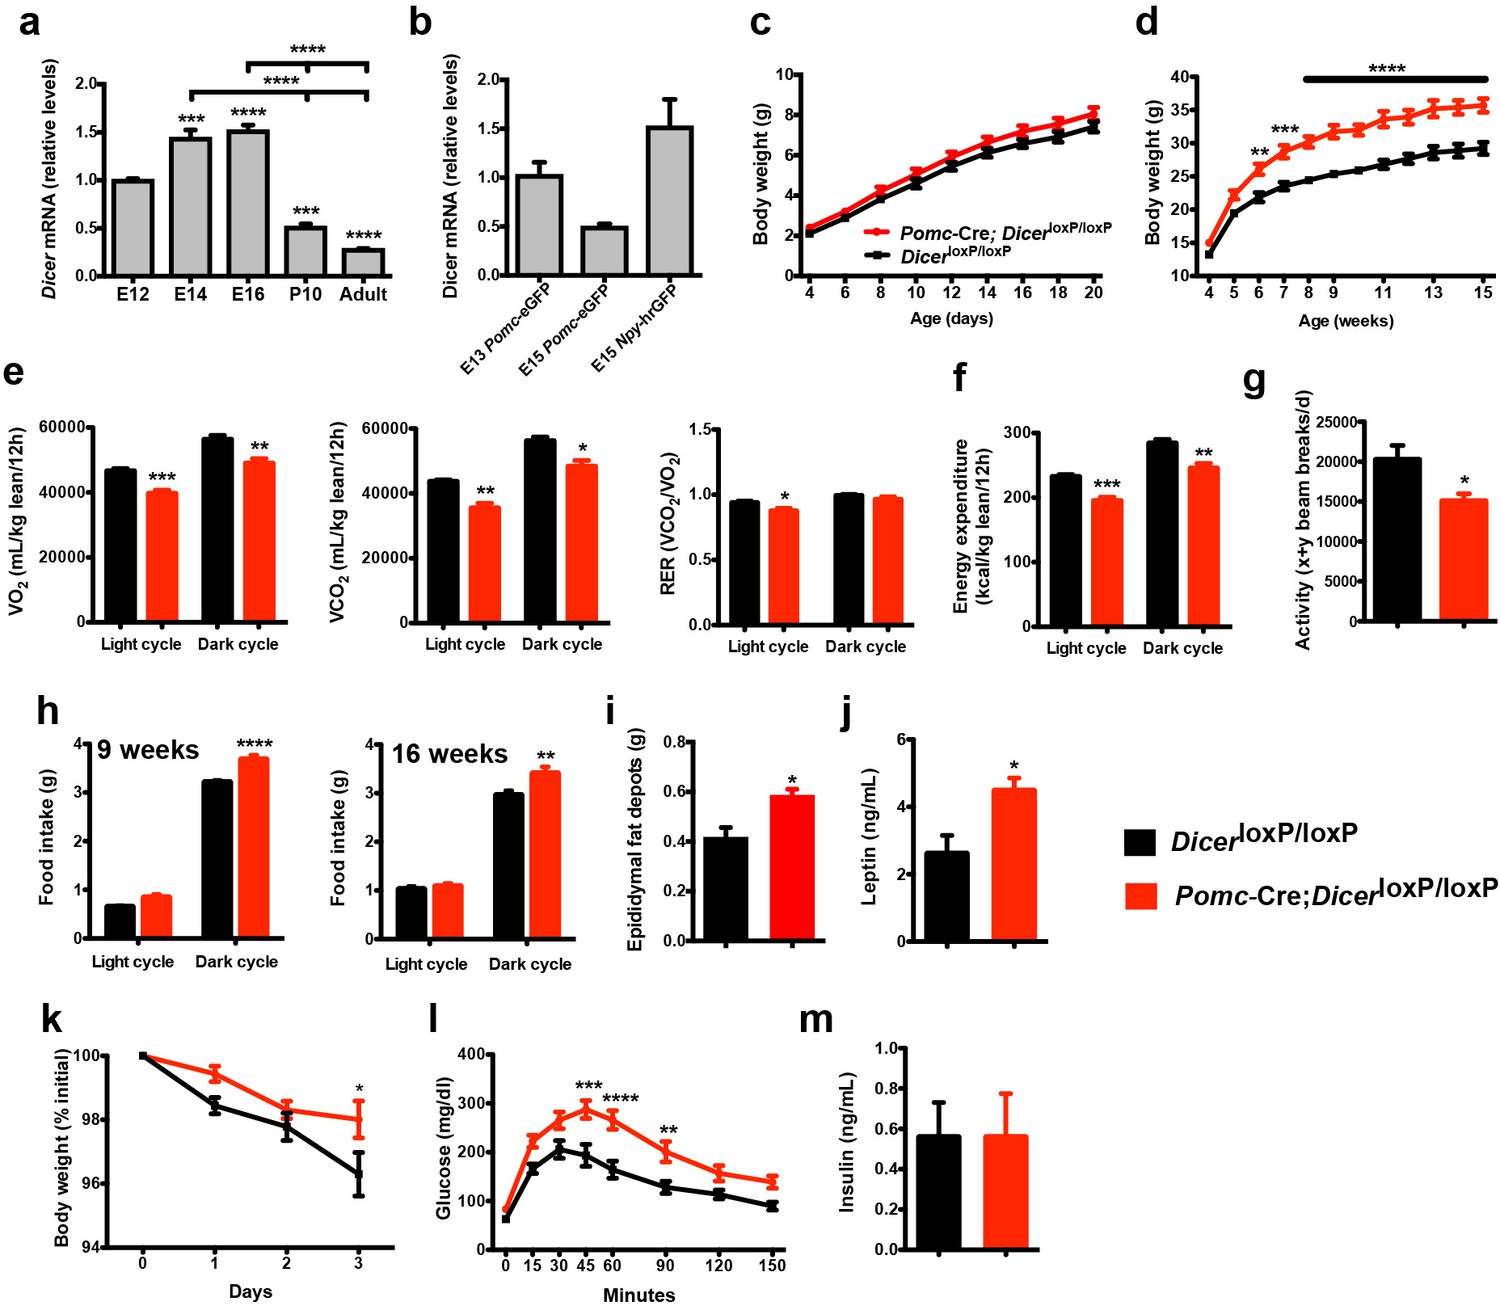
(a) Relative expression of Dicer mRNA in the hypothalamus of E12, E14, E16 embryos and in the mediobasal hypothalamus of P10, and adult mice (n = 3 – 5 per group). (b) Relative expression of Dicer mRNA in sorted Pomc-eGFP cells at E13 and E15 and Npy-hrGFP cells at E15 (n = 2 – 4 per group). (c) Pre- and (d) post-weaning growth curves (body weights) of DicerloxP/loxP and Pomc-Cre; DicerloxP/loxP male mice (n ≥ 8 per group). (e) VO2, VCO2 and respiratory exchange ratio (RER) of 15-week-old DicerloxP/loxP and Pomc-Cre; DicerloxP/loxP male mice (n = 4 – 6 per group). (f) Energy expenditure of 15-week-old DicerloxP/loxP and Pomc-Cre; DicerloxP/loxP male mice (n = 4 – 6 per group). (g) Locomotor activity of 15-week-old DicerloxP/loxP and Pomc-Cre; DicerloxP/loxP male mice (n = 4 – 6 per group). (h) Cumulative food intake of 9- and 16-week-old DicerloxP/loxP and Pomc-Cre; DicerloxP/loxP male mice (n = 5 – 6 per group). (i) Epididymal fat mass of 20- to 23-week-old male mice (n = 4 – 5 per group). (j) Plasma leptin levels in 20- to 23-week-old DicerloxP/loxP and Pomc-Cre; DicerloxP/loxP male mice (n = 4 – 5 per group). (k) Leptin-induced weight loss in 14-week-old DicerloxP/loxP and Pomc-Cre; DicerloxP/loxP male (n = 5 per group). (l) Glucose tolerance test of 10- to 11-week-old male mice (n ≥ 7 per group). (m) Plasma insulin levels in 20- to 23-week-old DicerloxP/loxP and Pomc-Cre; DicerloxP/loxP male mice (n = 6 per group). Values are shown as mean ±SEM. *p≤0.05 versus DicerloxP/loxP (e, g, i, j); **p≤0.01 versus DicerloxP/loxP (d, e, f, h, l); ***p≤0.001 versus E12 WT (a), versus DicerloxP/loxP (d, e, f, l); ****p≤0.0001 versus E12 WT (a), versus E14 WT (a), versus E16 WT (a), versus DicerloxP/loxP (d, l). Statistical significance was determined using 2-tailed Student’s t test (e, f, g, i, j, m), 1-way ANOVA followed by Turkey’s post hoc test (a, b) and 2-way ANOVA followed by Bonferroni’s post hoc test (c, d, h, k, l).
To determine whether Dicer is required for the normal development of POMC neurons in vivo, we crossed mice carrying a DicerloxP allele (Harfe et al., 2005) with mice expressing Cre recombinase in a Pomc-specific manner (Pomc-Cre) (Balthasar et al., 2004). The resulting Pomc-Cre; DicerloxP/loxP male mice displayed significantly higher body weights compared with control DicerloxP/loxP mice starting at 6 weeks of age (Figure 1c and d). In addition, Pomc-Cre; DicerloxP/loxP male mice displayed reduced oxygen consumption (VO2), carbon dioxide production (VCO2), respiratory quotient, energy expenditure, and locomotor activity (Figure 1e–g). In addition, mutant male mice had higher food consumption during dark phase (Figure 1h). Epididymal fat pad weights were also significantly higher in adult Pomc-Cre; DicerloxP/loxP male mice compared with DicerloxP/loxP mice (Figure 1i). Serum leptin levels were also significantly elevated in mutant male mice compared with control mice (Figure 1j). In addition, we performed leptin sensitivity tests and observed that the weight loss effect of leptin was attenuated in Pomc-Cre; DicerloxP/loxP male mice compared with DicerloxP/loxP mice (Figure 1k). In addition, when exposed to a glucose challenge, mutant male mice displayed impaired glucose tolerance compared with control mice (Figure 1l). However, basal insulin levels remained unchanged (Figure 1m). Most of the metabolic abnormalities were also found in female mice, including increased body weight, food intake, fat mass and reduced VO2, VCO2, and energy expenditure (Figure 1—figure supplement 1). Adult female mutant mice also displayed impaired glucose tolerance compared with control mice (Figure 1—figure supplement 1f). Together, these data indicate that the loss of Dicer in POMC neurons has functional consequences on energy balance and glucose regulation.
Loss of Dicer in POMC neurons is associated with a marked reduction in the number of Pomc mRNA-expressing cells
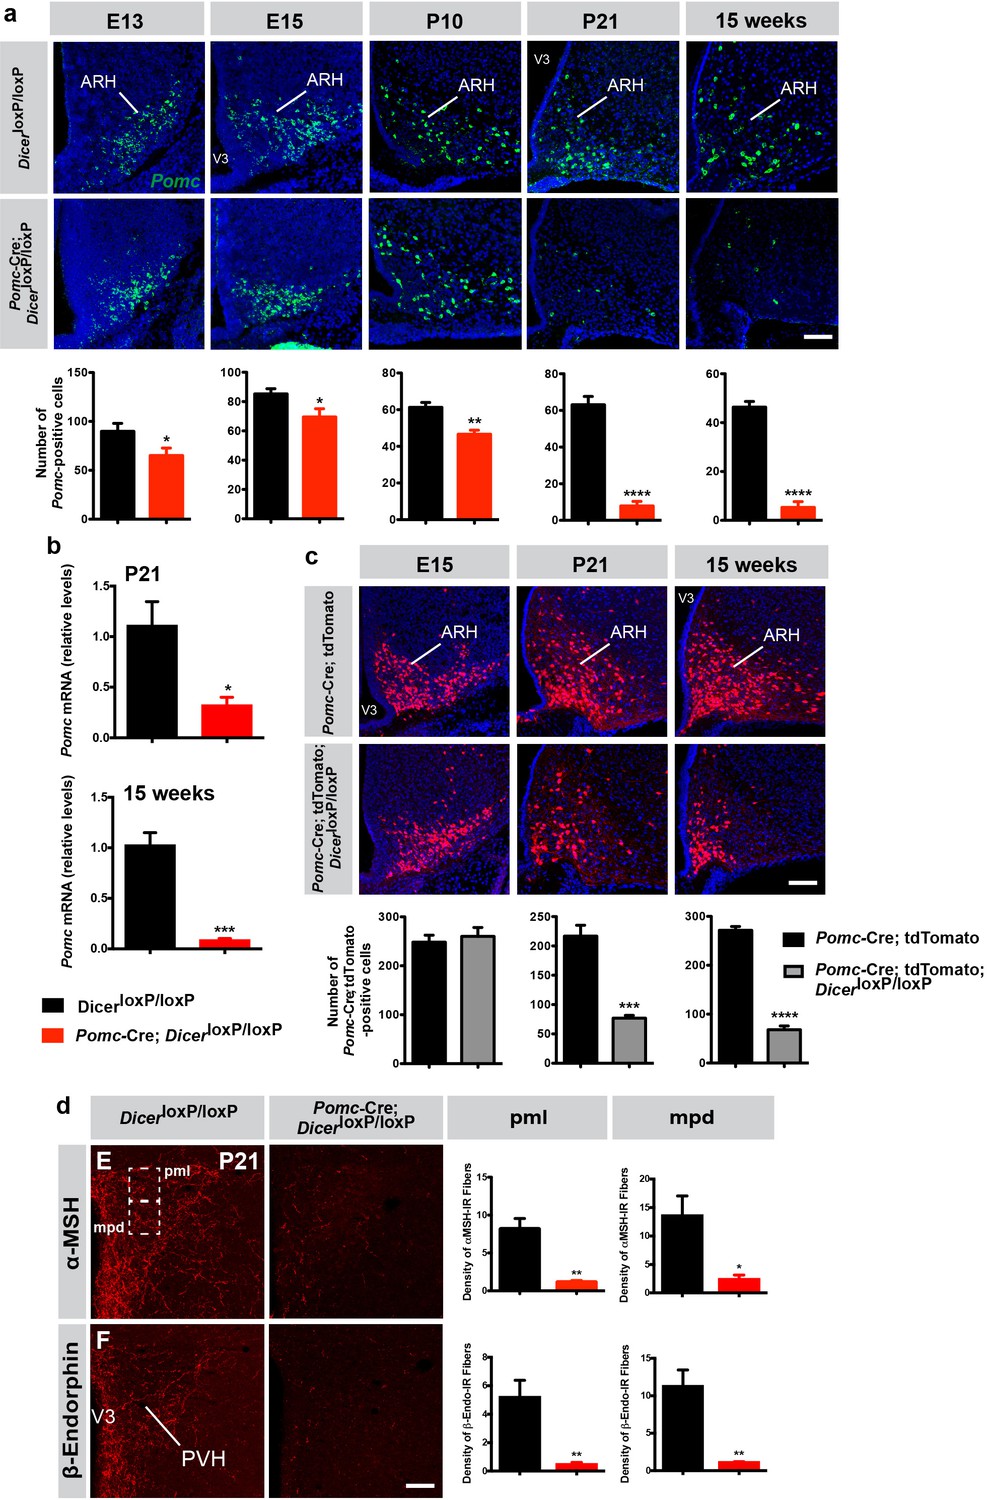
POMC neurons in the ARH are generated primarily on embryonic day (E) 11-E12 and acquire their terminal peptidergic phenotype during mid-late gestation (Padilla et al., 2010). Because miRNAs have recently emerged as critical regulators of brain development and Dicer mRNA is expressed in POMC neurons during important periods of neurogenesis and cell fate, we examined whether lack of miRNA maturation in POMC neurons causes neurodevelopmental alterations. We first performed in situ hybridization (ISH) experiments and counted the number of neurons expressing Pomc mRNA in the ARH of Pomc-Cre; DicerloxP/loxP and DicerloxP/loxP mice. The number of Pomc mRNA-expressing cells in the ARH of Pomc-Cre; DicerloxP/loxP embryos at E13 and E15 was 1.4- and 1.2-fold lower, respectively, than that observed in control embryos (Figure 2a). Pomc-Cre; DicerloxP/loxP mice P10 and P14 displayed a 1.3- and 1.5-fold reduction, respectively, in the number of Pomc mRNA-expressing cells (Figure 2a; Figure 2—figure supplement 1a). At weaning (P21) and in 15-week-old animals there was an 8.0- and 8.7-fold reduction, respectively, in the number of Pomc mRNA-expressing cells between mutant and control mice (Figure 2a). This marked reduction in the number of Pomc mRNA-expressing cells was accompanied by a decrease in Pomc mRNA content in the hypothalamus of P21 and 15-week-old mice (Figure 2b). In addition, a 3.7-fold reduction in the number of β-endorphin-immunoreactive cells (a peptide produced from POMC) was found in the ARH of Pomc-Cre; DicerloxP/loxP mice (Figure 2—figure supplement 1b). In addition, the density of α-MSH- and β-endorphin-immunoreactive fibers was 7.3- and 11.3-fold decreased, respectively, in the magnocellular part of the PVH and 5.7- and 10.3-fold decreased, respectively, in the parvicellular part of the PVH of mutant mice (Figure 2d).
Figure 2 with 1 supplement see all
Reduced number of Pomc mRNA-expressing cells in mice lacking Dicer in POMC neurons.
(a) Representative images and quantification of Pomc mRNA-expressing cells in the arcuate nucleus (ARH) of E13 (n = 6 per group), E15 (n = 6 – 8 per group), P10 (n = 4 per group), P21 (n = 4 per group) and 15-week-old (n = 3 – 4 per group) DicerloxP/loxP and Pomc-Cre; DicerloxP/loxP male mice. (b) Relative expression of Pomc mRNA in the mediobasal hypothalamus of P21 and 15-week-old DicerloxP/loxP and Pomc-Cre; DicerloxP/loxP male mice (n = 3 – 4 per group). (c) Representative images and quantification of Pomc-Cre cells genetically labeled by tdTomato in the ARH of E15 (n = 5 – 7 per group), P21 (n = 4 per group) and 15-week-old (n = 3 – 4 per group) Pomc-Cre and Pomc-Cre; DicerloxP/loxP male mice. (d) Representative images and quantification of the density of α-MSH- and β-endorphin-immunopositive fibers (n = 3 – 4 per group) in the posterior magnocellular (pml) and medial parvicellular (mpd) parts of the paraventricular nucleus (PVH) of P21 DicerloxP/loxP and Pomc-Cre; DicerloxP/loxP male mice. Scale bars, 100 μm (a, b, c). Values are shown as mean ± SEM. *p≤0.05 versus DicerloxP/loxP (a, b, d); **p≤0.01 versus DicerloxP/loxP (a, d); ***p≤0.001 versus DicerloxP/loxP (b), versus Pomc-Cre; tdTomato (c); ****p≤0.0001 versus DicerloxP/loxP (a), versus Pomc-Cre; tdTomato (c). Statistical significance was determined using 2-tailed Student’s t test. V3, third ventricle.
This dramatic reduction in the number of POMC-containing cells and fibers in the absence of Dicer could be caused by an increase in cell death as previously reported in various neuronal systems, including the hypothalamus (Sundermeier et al., 2014; Zehir et al., 2010; Damiani et al., 2008; Schneeberger et al., 2012). It is also possible that some cells survive but that Pomc gene expression is blunted in Pomc-Cre; DicerloxP/loxP mice. To test this hypothesis, we used a cell lineage approach and crossed our Pomc-Cre mouse line with a ROSA-tdTomato reporter line to genetically and permanently label Pomc progenitor cells, independently of Pomc mRNA content. Despite a marked reduction in the number of Pomc mRNA-expressing cells at E15 (Figure 2a), the number of tdTomato+ cells was identical between Pomc-Cre; DicerloxP/loxP and DicerloxP/loxP mice at E15 (Figure 2c). At P14 (Figure 2—figure supplement 1d) and weaning (P21, Figure 2c), we observed a 1.9- and 2.9-fold reduction, respectively, in the number of tdTomato+ cells in mutant mice. The number of tdTomato+ cells found in the ARH was 4-fold reduced at 15 weeks of age (Figure 2c) but this reduction was not as marked as the decrease in the number of Pomc mRNA-expressing cells that we observed using in situ hybridization (8.7-fold, Figure 2a). These observations indicate that this reduction in POMC cell numbers is caused by a decrease in Pomc detectability versus cell loss. In addition, a significant reduction in POMC-immunoreactive cell numbers was observed in the pituitary of mutant mice but no change in tdTomato +cell numbers was found in the NTS, another brain site that contains POMC neurons (Figure 2—figure supplement 1e and f). These observations support the idea that loss of Dicer in hypothalamic Pomc progenitor cells causes postnatal cell death but also blunts Pomc gene expression and might favor acquisition of a non-POMC phenotype.
Loss of dicer in POMC neurons favors the differentiation of Pomc-expressing progenitors into NPY neurons
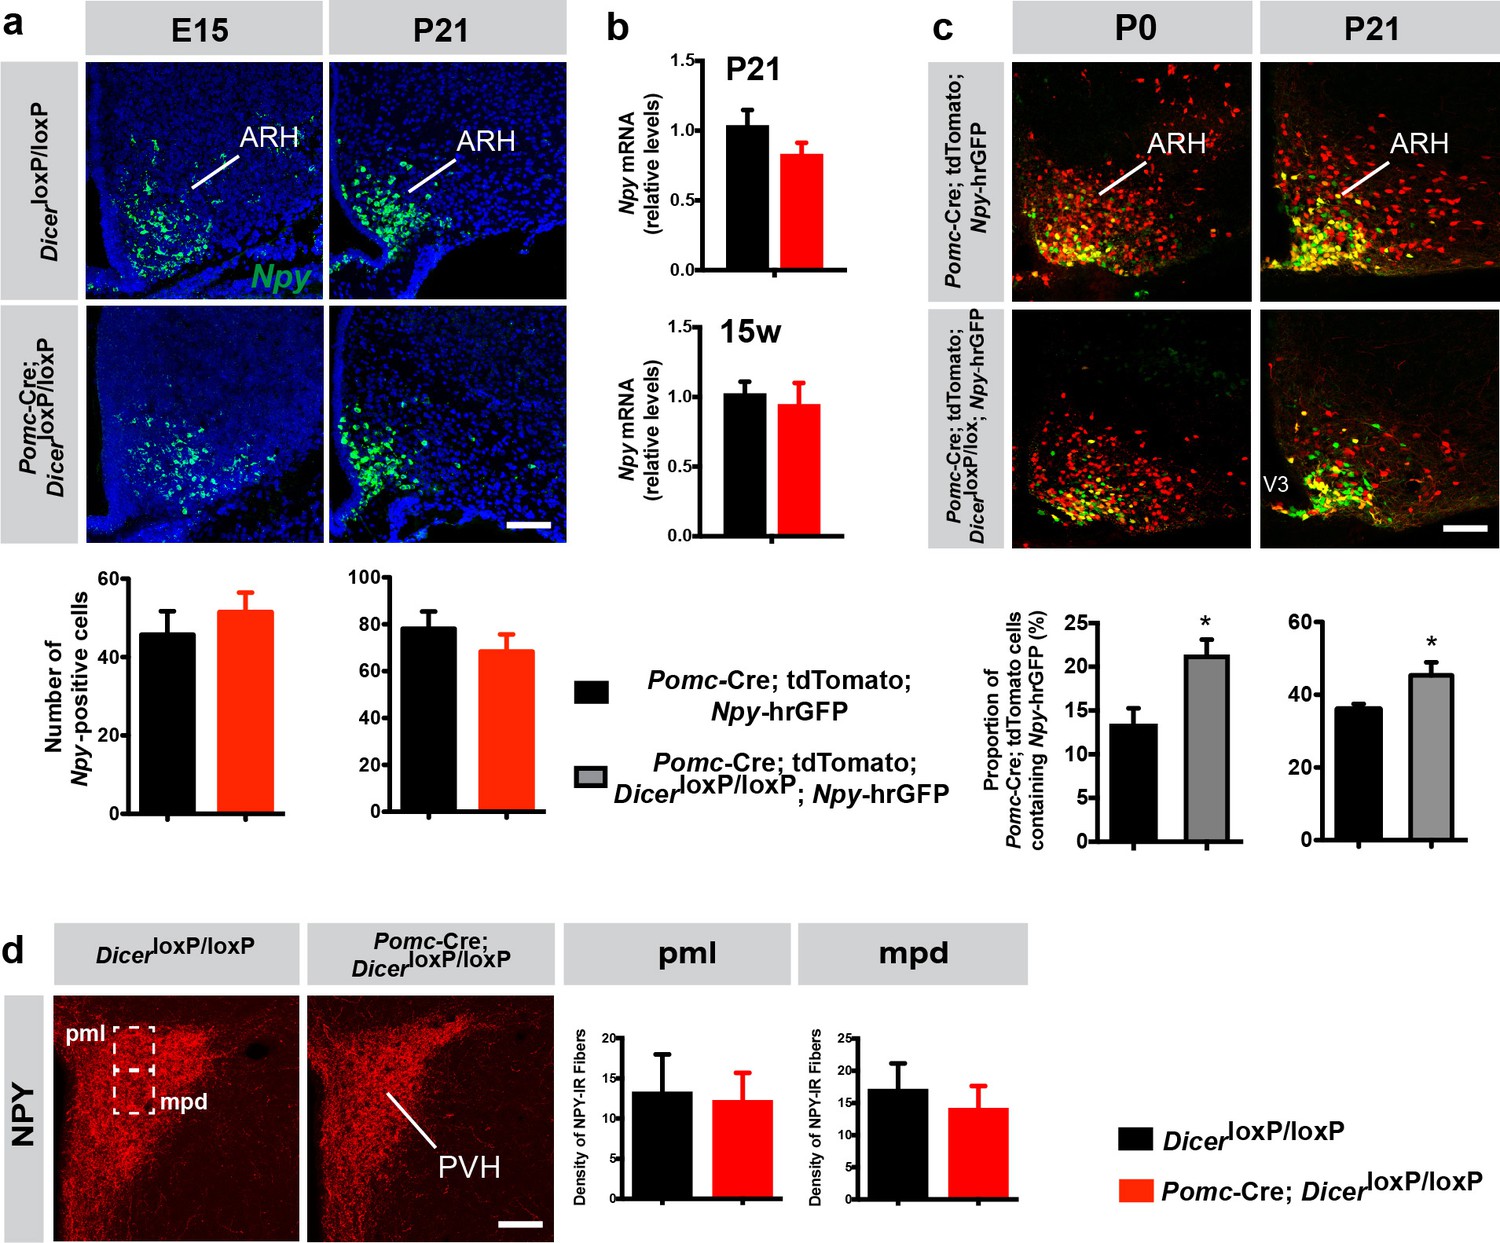
Our data indicate a portion of genetically labeled Pomc-tdTomato+ cells do not express Pomc mRNA in Pomc-Cre; DicerloxP/loxP mice. Because Pomc progenitors are known to adopt a POMC but also a non-POMC phenotype such as NPY (Padilla et al., 2010), we next quantified the number of NPY neurons in the ARH of control and mutant mice. First we performed in situ hybridizations and counted the number of Npy mRNA-expressing neurons and found that it was identical between Pomc-Cre; DicerloxP/loxP and DicerloxP/loxP mice at E15, P14, and P21 (Figure 3a; Figure 2—figure supplement 1c). Consistent with these findings, RT-qPCR experiments indicated that Npy mRNA levels in the hypothalamus were comparable between Pomc-Cre; DicerloxP/loxP and DicerloxP/loxP mice (Figure 3b). We also performed immunohistochemical analyses and found no difference in the density of NPY-immunoreactive fibers between control and mutant mice at P21 (Figure 3d). Together, these results support the hypothesis that lack of Dicer does not cause death of Pomc progenitors that subsequently adopt a NPY phenotype.
Figure 3
Loss of Dicer in POMC neurons favors the differentiation of Pomc-expressing progenitors into NPY neurons.
(a) Representative images and quantification of Npy mRNA-expressing cells in the arcuate nucleus (ARH) of E15 (n = 5–6 per group) and P21 (n = 4 per group) DicerloxP/loxP and Pomc-Cre; DicerloxP/loxP male mice. (b) Relative expression of Npy mRNA in the mediobasal hypothalamus of P21 and 15-week-old DicerloxP/loxP and Pomc-Cre; DicerloxP/loxP male mice (n = 3–4 per group). (c) Representative images and quantification of Pomc-Cre tdTomato + cells that co-express Npy-hrGFP in the ARH of P0 (n = 5–6 per group) and P21 (n = 3 per group) Pomc-Cre and Pomc-Cre; DicerloxP/loxP male mice. (d) Representative images and quantification of the density of NPY-immunopositive fibers (n = 3–4 per group) in the posterior magnocellular (pml) and medial parvicellular (mpd) parts of the paraventricular nucleus (PVH) of P21 DicerloxP/loxP and Pomc-Cre; DicerloxP/loxP male mice. Scale bars, 100 μm (a, c, d). Values are shown as mean ± SEM. *p≤0.05 versus Pomc-Cre; tdTomato; Npy-hrGFP (c). Statistical significance was determined using 2-tailed Student’s t test. V3, third ventricle.
To determine if miRNAs influence the differentiation of Pomc progenitor cells into a NPY phenotype, we counted the number of Pomc-expressing progenitor cells that acquire a NPY phenotype by crossing Pomc-Cre; tdTomato; Npy-hrGFP mice with DicerloxP/loxP mice. At birth (P0) and P21, the proportion of Pomc-expressing progenitor cells that became NPY neurons was 1.6- and 1.3-fold increased, respectively, in mutant compared to control mice (Figure 3c). These data indicate that loss of miRNA maturation in POMC neurons favors the differentiation of Pomc progenitor cells into mature NPY neurons.
Identification of miRNAs uniquely expressed in Pomc progenitors that become NPY neurons
To identify miRNAs that might be required for the differentiation of Pomc progenitors into POMC or NPY neurons, we performed ‘miRNome’ expression profiling using miRNA microarrays on RNA from E15 Pomc-eGFP cells (i.e., Pomc progenitors that kept a POMC phenotype) (Figure 4a) and from E15 Pomc-Cre; tdTomato; Npy-hrGFP cells (i.e., Pomc progenitors that acquired a NPY phenotype) (Figure 4b) sorted by flow cytometry. We specifically studied embryos at E15 because this age represents an important developmental period for the differentiation of Pomc progenitor cells into either a POMC or a NPY phenotype (Padilla et al., 2010). As expected, GFP-positive cells sorted from Pomc-eGFP hypothalami contained high levels of Pomc mRNA and low levels of Npy mRNA (Figure 4c and d). In contrast, GFP-positive cells sorted from Npy-hrGFP hypothalami and GFP +tdTomato cells sorted from Pomc-Cre; tdTomato; Npy-hrGFP embryos contained high levels of Npy mRNA and very low levels of Pomc mRNA (Figure 4c and d; Figure 4—figure supplement 1a). Out of 722 miRNA-specific probe sets, expression of 46 miRNAs was significantly changed in E15 Pomc→NPY cells compared with E15 Pomc→POMC cells, of which 22% were increased and 78% were decreased (Figure 4e and f; Figure 4—figure supplement 1b; Supplementary file 1). Particularly, this screen revealed a marked reduction in the expression of miR-103 and miR-107, two miRNAs that have been previously associated with obesity-induced insulin resistance in the liver and adipose tissue (Trajkovski et al., 2011). Using RT-qPCR, we confirmed that miR-103 and miR-107 levels were 4.0- to 4.5-fold down-regulated in E15 Pomc→NPY cells compared with E15 Pomc→POMC cells (Figure 4g). Moreover, a 3.2- and 1.4-fold reduction in miR-103 and miR-107 expression, respectively, was observed in sorted Pomc cells of Pomc-Cre; DicerloxP/loxP mice (Figure 4—figure supplement 1c). These data indicate that miR-103/107 might play a key role in determining whether a Pomc progenitor acquires a POMC or a NPY phenotype.
Figure 4 with 1 supplement see all

miR-107 silencing modulates Pomc and Npy expression and impairs long-term glucose homeostasis.
Images and FACS isolation of (a) Pomc-eGFP+ and (b) Pomc-tdTomato+/Npy-hrGFP+ cells from E15 hypothalami (n = 43 – 53 per group). Arrow heads point to double-labeled cells. Relative expression of (c) Pomc, (d) Npy, and (g) miR-103 and miR-107 mRNA in sorted Pomc-eGFP, Npy-hrGFP, and Pomc-Cre; tdTomato; Npy-hrGFP cells at E15 (n = 2 – 4 per group). (e) Scatterplots and (f) histograms showing the miRNA fold change in E15 Pomc-tdTomato/Npy-GFP+ cells compared with E15 Pomc-eGFP+ cells (n = 1 per group, pool of 4 – 7 samples). Relative expression of hypothalamic (h) miR-107, (j) Pomc, and (l) Npy mRNA in E15 embryos injected with antagomirs against miR-107 (Ant-107) or vehicle at E12 (n = 5 – 18 per group). Correlation between hypothalamic (i) Pomc and (k) Npy mRNA expression and miR-107 expression in E15 embryos injected with Ant-107 at E12 (n = 10 – 12 per group). (m) Relative expression of miR-107 mRNA in hypothalamic embryonic explants incubated with Ant-107 or control Ant-Scr (n = 10 – 13 per group). (n) Images and quantification of Pomc-Cre tdTomato + cells that express Npy-hrGFP in hypothalamic embryonic explants incubated with Ant-107 or control Ant-Scr (n = 5 – 6 per group). (o) Quantification of Pomc-Cre tdTomato + cells that express Pomc-eGFP in hypothalamic embryonic explants incubated with Ant-107 or control Ant-Scr (n = 3 – 5 per group). (p) Experimental overview. (q) Pre- and post-weaning growth curves (body weights) of male mice injected with locked nucleic acids against miR-107 (LNA-107) or scrambled control LNA (LNA-Scr) at E12 (n = 4 – 10 per group). (r) Body composition of 15-week-old male mice injected with LNA-107 or control LNA-Scr at E12 (n = 7 – 10 per group). (s) Glucose tolerance test of 10-week-old male mice injected with LNA-107 or control LNA-Scr at E12 (n = 4 – 6 per group). Dark blue line represents animals with more than 28% reduction in the number of POMC neurons. (t) Correlation between the glucose area under the curve during GTT and number of POMC neurons in 10-week-old male mice injected with LNA-107 at E12 (n = 8 animals). Dark blue squares represent animals with more than 28% reduction in the number of POMC neurons. Scale bars, 100 μm (a, b) and 40 μm (n). Data are presented as mean ±SEM. *p≤0.05 versus vehicle (j, l), versus Ant-Scr (o); **p≤0.01 versus E15 Pomc-eGFP (c), versus Ant-Scr (n), versus LNA-Scr (s); ***p≤0.001 versus Ant-Scr (m); ****p≤0.0001 versus vehicle (h). Statistical significance was determined using 2-tailed Student’s t test (h, j, l–o), linear regression (i, k, t), 1-way ANOVA followed by Tukey’s post hoc test (c, d, g), and 2-way ANOVA followed by Bonferroni’s post hoc test (q, r, s). ARH, arcuate nucleus of the hypothalamus; V3, third ventricle.
In vitro silencing of miR-107 influences pomc progenitor specification into NPY neurons
To examine the impact of miR-103 and miR-107 in Pomc and Npy gene expression, we used antagomirs against miR-107 (Ant-107), a class of oligonucleotides that silence endogenous miRNAs (Krützfeldt et al., 2005). We injected these antagomirs directly into the ventricular cavity of wild-type mouse embryos in utero at E12. RT-qPCR analysis 72 hr post-injection revealed that Ant-107 caused a 2.2-fold decrease in miR-107 expression (Figure 4h). As previously reported (Trajkovski et al., 2011), Ant-107 also down-regulated miR-103 expression (data not shown). No correlation was observed between Pomc mRNA and miR-107 expression (Figure 4i). However, in embryos that displayed a knockdown efficiency greater than 60%, we found that blocking miR-107 caused a 2.4-fold decrease in Pomc mRNA expression (Figure 4j). In addition, there was a negative correlation between Npy mRNA expression and miR-107 expression (Figure 4k). When embryos displayed a knockdown efficiency greater than 60%, there was a 3.9-fold increase in Npy mRNA expression compared to control (Figure 4l).
We then established an in vitro model to study the role of miR-107 in Pomc progenitor differentiation. The hypothalami of Pomc-Cre; tdTomato; Npy-hrGFP embryos were dissected at E12 and prepared for incubation in a hanging drop setup (Kredo-Russo and Hornstein, 2011). These organotypic explants were then incubated with Ant-107 or scrambled control antagomirs against miR-690 (Ant-Scr). After 72 hr, the addition of the Ant-107 to the culture medium produced a 4.9-fold reduction in miR-107 expression (Figure 4m). This reduction in miR-107 expression was accompanied with a 3.2-fold increase in the proportion of Pomc progenitors that differentiate into NPY neurons (Figure 4n). Interestingly, the silencing of miR-107 is also accompanied with a 1.2-fold reduction in the number of Pomc-expressing progenitors that express Pomc-eGFP (Figure 4o). These observations support the hypothesis that a reduction in miR-107 expression favors the differentiation of Pomc progenitors into a NPY phenotype versus a POMC phenotype.
In utero silencing of miR-103/107 has long-term effects on glucose homeostasis
The data described above support a role for miR-103/107 in the peptidergic differentiation of Pomc progenitor cells during embryonic life. To further explore the importance of prenatal miR-107 in lifelong metabolic regulation, we synthesized locked nucleic acids that specifically target the seed sequence of miR-107 and inhibit its expression (LNA-107), injected them into the ventricular cavity of wild-type mouse embryos at E12. We observed a 2-fold reduction in miR-107 expression in the hypothalami of E14 embryos that received LNA-107 at E12 compared to control mice (Figure 4p; Figure 4—figure supplement 1d). Physiologically, the pre- and post-weaning growth curves (body weights) of injected mice injected with LNA-107 prenatally were undistinguishable from those of control mice (Figure 4q). Similarly, body composition was similar between LNA-107-injected and control mice (Figure 4r). However, when exposed to a glucose challenge, adult mice that received LNA-107 injections prenatally and had 34% loss in POMC neurons displayed impaired glucose tolerance compared with control mice (Figure 4s). In addition, there was a negative correlation between the glucose area under the curve during GTT and the number of POMC neurons (Figure 4t).
Discussion
Several lines of evidence have indicated that small non-coding RNAs or miRNAs are involved in the regulation of metabolism and neural development (Coolen and Bally-Cuif, 2009; Oliverio et al., 2016; Fineberg et al., 2009; Vo et al., 2010; Deiuliis, 2016; McGregor and Choi, 2011; Schneeberger et al., 2012; Jordan et al., 2011; Kornfeld et al., 2013). However, whether miRNAs play a role in the development of CNS pathways that control energy balance remains elusive. In the present study, we report that loss of Dicer, an enzyme critical to process miRNA precursors (pre-miRNAs) into mature miRNAs (miRNAs), in POMC neurons causes metabolic disturbances in mice associated with an age-related decline in the number of Pomc mRNA-expressing cells. We also show that Dicer influences the peptidergic differentiation of Pomc progenitor cells during embryonic life, a developmental process that appears to be specifically mediated through miR-103/107.
A marked reduction in the number of Pomc mRNA-expressing cells was observed in the absence of Dicer. The number of neurons is a function of several developmental processes including cell proliferation, migration, death but also cell differentiation. The majority of neurons located in the mouse hypothalamus, including POMC neurons, are born between E11 and E12 (Ishii and Bouret, 2012; Padilla et al., 2010). The observation that number of Pomc mRNA-expressing cells is reduced as early as at E13 suggests that neurogenesis might be impaired in Pomc-Cre; DicerloxP/loxP mice, as previously reported in other brain regions such as the cortex and spinal cord (Kawase-Koga et al., 2009). The distribution pattern of POMC neurons in mutant mice resembles that of control mice, supporting the idea that Dicer does not influence POMC cell migration. Our neuroanatomical analysis also revealed that Dicer deficiency causes a marked reduction in the number of Pomc mRNA-expressing cells particularly after birth and that 90% of POMC+ cells are loss in the arcuate nucleus of adult Pomc-Cre; DicerloxP/loxP mice. This dramatic reduction in the number of Pomc mRNA-expressing neurons might be the result of increased cell death consistent with previous papers implicating Dicer and miRNAs in cell survival of various neuronal systems including the retina, the neural crest, and the hypothalamus (Sundermeier et al., 2014; Zehir et al., 2010; Damiani et al., 2008; Schneeberger et al., 2012). However, our cell lineage tracing experiments that allowed us to genetically label Pomc-expressing cells, independently of Pomc mRNA content, further revealed that a significant number of neurons survive in mutant mice and that Pomc mRNA expression is blunted in these neurons. Because in our mouse model Cre activity is turned on in Pomc-expressing cells from embryonic life to adulthood, future studies using temporal deletion of Dicer are required to investigate its relative contribution on developmental processes versus adult regulations.
A unique developmental property of POMC neurons during embryonic life is that they can adopt an orexigenic NPY phenotype (Padilla et al., 2010). Here we show that Pomc-Cre; DicerloxP/loxP mice display a higher number of Pomc progenitors that differentiate into a NPY phenotype. We also report that this developmental process involves miR-103/107. These data are in agreement with previous findings showing that miRNAs can be involved in cell fate determination during brain development (Fazi and Nervi, 2008). For example, the transcriptional repressor RE1 silencing transcription factor interacts with miR-124a to maintain neuronal progenitors in a non-neuronal cells lineage. When progenitors differentiate in mature neurons, REST leaves the miR-124a loci enabling miR-124a to repress non-neuronal transcripts (Conaco et al., 2006). Our in vivo experiments indicate that miR-103/107 regulate Pomc and Npy gene expression. The exact molecular mechanisms underlying the effect of miR-103/107 on Pomc and Npy mRNA levels remain to be studied as these miRNAs do not directly target POMC or NPY 3’-UTRs. Transcription factors such as neurogenin three and Mash1 have been shown to be involved in the neurogenesis and the specification of POMC and NPY neurons (Pelling et al., 2011; McNay et al., 2006). However, predicting target gene analysis revealed that these transcription factors are not direct targets for miR-103/107. Nevertheless, the present study represents the first demonstration that miR-103/107 might influence hypothalamic development. It is also the first study that analyzes the molecular mechanisms that underlie the timely differentiation of Pomc progenitors into a POMC versus NPY phenotype. It remains possible that the loss of Dicer and miR-103/107 might also result in the differentiation of Pomc progenitors into other phenotypes. For example, Sanz et al. have shown that a sub-population of Pomc-expressing progenitors can also differentiate into kisspeptin and tachykinin neurons (Sanz et al., 2015).
The role of miR-103/107 in metabolic regulation has mainly been studied in the periphery. miR-103/107 control glucose homeostasis and are upregulated in the liver of obese mice (Trajkovski et al., 2011). Silencing miR103/107 in the liver and fat improves glucose homeostasis and insulin sensitivity (Trajkovski et al., 2011). In contrast, gain of miR-103/107 function in either the liver or adipose tissue induces impaired glucose homeostasis (Trajkovski et al., 2011). Moreover, overexpression of miR-107 induces endoplasmic reticulum stress in the liver and causes lipid accumulation in adipocytes (Bhatia et al., 2014). In addition, Vinnikov and colleagues reported that intra-ARH delivery of miR-103 mimics ameliorate hyperphagia and obesity in mice lacking Dicer in forebrain neurons (Vinnikov et al., 2014). However, this study did not examine glucose homeostasis and mimic injections were performed in adult mice. Our data indicate that blockade of miR-107 in the prenatal brain affects glucose homeostasis with no significant effect on body weight or body composition. These findings contrast with the phenotype of Pomc-Cre; DicerloxP/loxP mice that display obesity in addition to perturbations in glucose homeostasis. These observations indicate that miRNAs other than miR-103/107 might be involved in the central regulation of body weight and adiposity. For example, miR-155 has recently been suggested to play a role in the central regulation of body weight and food intake (Maldonado-Avilés et al., 2018). In any events, by combining the use of miRNA manipulation with cell lineage, and physiological experiments, the present study reveals a novel role for miR-103/107 in determining the ultimate peptidergic phenotype of hypothalamic neurons involved in glucose regulation.
Materials and methods
Animals
All experimental procedures were approved by the Institutional Animal Care and Use Committee of Children’s Hospital of Los Angeles (protocol #303 – 16). Mice were grouped-housed in individual cages under specific pathogen-free conditions, maintained in a temperature-controlled room with a 12 hr light/dark cycle, and provided ad libitum access to water and standard laboratory chow (Special Diet Services). Pomc-Cre mice (Jax mice stock# 5965) (Balthasar et al., 2004) were mated to DicerloxP/loxP mice (Jax mice stock# 6001) (Harfe et al., 2005) to generate Pomc-specific DICER knockout (Pomc-Cre; DicerloxP/loxP). These mice were then crossed with a ROSA-tdTomato reporter line (Jax mice stock# 7914) (Madisen et al., 2010) so that neurons that express Pomc from gestation are permanently marked. This triple transgenic mouse model was also crossed with mice that selectively express humanized renilla GFP (hrGFP) in Npy-containing neurons (generously provided by Dr. Bradford Lowell) to facilitate the visualization of Pomc→NPY neurons. Homozygous transgenic mice that selectively express an enhanced GFP (eGFP) in Pomc-containing neurons were kindly provided by Dr. Malcolm J. Low. CD-1 and C57Bl/6 mice (Jax mice) were also used for intra-embryonic experiments. For the studies involving embryos, the breeders were mated around 6:00 pm and checked for a vaginal plug the next day. The day of conception (sperm positive vaginal smear) was designated as embryonic day (E) zero (E0). The day of birth was considered postnatal day 0 (P0).
MicroRNA inhibitors
Request a detailed protocolThe term antagomir refers to cholesterol-conjugated modified RNA (Krützfeldt et al., 2005). Oligonucleotides used in this study consisted of 22 or 23 nucleotides with followed modifications. mmu-miR-690 (scrambled antagomir):
5’-mU*mU*mUmGmGmUmUmGmUmGmAmGmCmCmUmAmGmCmC*mU*mU*mU*−3’ chol ; mmu-miR-107 :
5’-mU*mG*mAmUmAmGmCmCmCmUmGmUmAmCmAmAmUmGmCmU*mG*mC*mU*−3’chol. (m = 2’-O-methyl, *=phosphorothioate).
The term LNA refers to custom-made miRCURY locked nucleic acids (LNA) for in vivo application. They were designed and synthetized as unconjugated or FAM-conjugated and contain phosphorothioate oligonucleotides (Exiqon). The sequence of the LNA targeting miR-107 (LNA-107) was complementary to the mature mmu-miR-107 – 3 p : 5’-CCTGTACAATGCTGC-3’. The conjugated scrambled LNA (LNA-Scr) sequence is the following : 5’/56-FAM/ACGTCTATACGCCCA-3’.
Intra-embryonic injections
Request a detailed protocolTimed-pregnant WT mice carrying E12 embryos were anesthetized, and the uterine horns were gently placed outside the abdominal cavity. Using a Nanofil syringe with a 35G needle attachment (World Precision Instruments), miR-107 antagomirs (Ant-107, 0.5 nmol, Dharmacon; for gene expression studies) or LNA-107 (1 nmol, Exiqon; for physiological studies) was then delivered into each embryo intracerebroventricularly. KPBS, scrambled antagomirs (Ant-Scr) or LNA (LNA-Scr) were used as control. After injections, the uterus was carefully placed back into the pregnant mother and the incision was closed with sutures. Each experiment included offspring from at least three litters.
Hanging drop tissue culture
Request a detailed protocolThe hypothalami of Pomc-Cre; tdTomato; Pomc-eGFP (n = 8 embryos from two independent experiments) and Pomc-Cre; tdTomato; Npy-hrGFP E12 embryos (n = 13 embryos from four independent experiments) were microdissected under a stereomicroscope and prepared for incubation in a hanging drop setup as previously described (Kredo-Russo and Hornstein, 2011). Explants were incubated in fresh modified Basal Medium Eagle (Invitrogen) containing antagomirs against miR-107 or miR-690 (scrambled control) (0.2 nmol, Dharmacon). After 3 days in vitro, the explants were fixed in 4% paraformaldehyde, frozen and sectioned.
Tissue collection
Request a detailed protocolHypothalami of E12, E14, E16 and mediobasal hypothalami of P10, P21 and 15 week-old DicerloxP/loxP and Pomc-Cre; DicerloxP/loxP mice (n = 3 – 5 per group) were microdissected under a stereomicroscope.
Cell sorting
Request a detailed protocolHypothalami of E13 Pomc-eGPP (41 embryos from six litters), E15 Pomc-eGPP (53 embryos from seven litters), E15 Npy-hrGFP (46 embryos from six litters), E15 Pomc-Cre; tdTomato; Npy -hrGFP (43 embryos from five litters) and P21 Pomc-Cre; tdTomato; DicerloxP/loxP mice and Pomc-Cre; tdTomato mice (n = 4 per group) were microdissected under a stereomicroscope and enzymatically dissociated using the Papain Dissociation System (Worthington) following the manufacturer's instructions. Fluorescence-Activated Cell Sorting (FACS) was performed using a BD FACS Aria II Cell Sorter to sort Pomc-eGFP +cells, Npy-hrGFP +cells and cells containing both Pomc-Cre; tdTomato and Npy-hrGFP. Non-fluorescent cells obtained from wild-type mice were used set the threshold for fluorescence.
RT-qPCR analyses
Request a detailed protocolRNA containing the miRNA fraction was then extracted using the MiRVana miRNA isolation kit (Ambion) according to the manufacturer's protocol.
For miRNA expression analyses, cDNA was prepared from 10 ng total RNA using TaqMan MicroRNA Reverse Transcription Kit (Life Technologies). qRT-PCR was performed using TaqMan Universal PCR Mastermix No AmpErase UNG and the commercially available Taqman MicroRNA primers for hsa-miR-103 (000439), hsa-miR-107 (000443) and hsa-miR-690 (001677). Sno135 (001230) or U6snRNA (001973) were used for endogenous control.
For gene expression analyses, cDNA was generated with the high-capacity cDNA Reverse Transcription kit (Life Technologies). qRT-PCR was performed using TaqMan Fast Universal PCR Mastermix and the commercially available Taqman gene expression primers for Pomc (Mm00435874_m1), Npy (Mm03048253_m1), and Dicer (Mm00521722_m1). Gapdh (Mm99999915_g1) was used for endogenous control.
All assays were performed using an Applied Biosystems 7900 HT real-time PCR system. Calculations were performed by a comparative method (2−ΔΔCT).
Microarray analysis
Request a detailed protocolsix samples were pooled for E15 Npy-hrGFP +cells, seven samples were pooled for E15 Pomc-eGFP +cells and four samples for Pomc-Cre; tdTomato; Npy-hrGFP +cells. 125 ng of total RNA for each sample obtained from sorted cells was labeled using the FlashTag Biotin RNA Labeling kit (Genisphere) and hybridized to a GeneChip miRNA 2.0 array (Affymetrix) according to the manufacturer’s instructions. Affymetrix miRNA array chips identify miRNAs and pre-miRNAs in 131 organisms. Content is derived from Sanger miRbase miRNA database V15. Raw data files were imported into the Partek Genomic Suite 6.6 beta software (USC) and signal intensities for probe sets were quantile- normalize by robust multichip averaging (RMA) using miRNA-2_0.annotations.20101222.csv.
Tissue preparation
Request a detailed protocolP0, P10, P14, P21 and 15-week-old were anesthetized and perfused transcardially with 4% paraformaldehyde (n = 3 – 6 per group). For embryonic tissue, dams were anesthetized and E13 and E15 embryos (n = 5 – 8 per group) were dissected in cold PBS and fixed 4% paraformaldehyde. The brains were then frozen and 20- (for embryos and P0, P10 and P14 mice) or 30-um-thick coronal sections (for P21 and adults) were performed and collected on slides.
Immunohistochemistry
Request a detailed protocolSections were processed for immunofluorescence using standard procedures (Bouret et al., 2004b; Steculorum et al., 2015; Croizier et al., 2016). The primary antibodies used for IHC were as follows: sheep anti-α-MSH (1:40,000, Millipore; Steculorum et al., 2015), sheep anti-NPY (1:3,000, Chemicon; Lee et al., 2013), rabbit anti-β-endorphin (1:5,000, Millipore; Grayson et al., 2010), rabbit anti-POMC (1:2,000, Phoenix Pharmaceuticals; MacKay et al., 2017). The primary antibodies were visualized with Alexa Fluor 568 goat anti-rabbit IgGs or Alexa Fluor 568 donkey anti-sheep IgGs (1:200, Invitrogen). Sections were counterstained using bisbenzamide (1:10,000, Invitrogen), to visualize cell nuclei, and coverslipped with buffered glycerol (pH 8.5).
Fluorescent in situ hybridization
Request a detailed protocolSense and antisense digoxigenin-labeled riboprobes were generated from plasmids containing PCR fragments of Npy and Pomc. Sections were post-fixed in 4% paraformaldehyde and incubated with Proteinase K (Promega). They were incubated in triethanolamine (TEA) and then in TEA containing glacial acid acetic. Sections were pre-hybridized in hybridization buffer and then hybridized with denatured probes (300 ng for Npy and 400 ng for Pomc) overnight at 62 C. After washes in stringency solutions, sections were blocked in TNB solution (Roche) and incubated in a horseradish peroxidase-conjugated sheep anti-DIG antibody (1:400, Roche Applied Sciences; Padilla et al., 2010). DIG was visualized using a TSA PLUS Biotin Kit (Perkin Elmer). Sections were first incubated in the Biotin Amplification Reagent (1:50), and then in cyanin 2-conjugated streptavidin (1:200, Jackson Immunoresearch). Sections were counterstained using bisbenzamide (1:10,000, Invitrogen) to visualize cell nuclei.
Image analysis
Request a detailed protocolImages were acquired using a Zeiss LSM 710 confocal system equipped with a 20X objective through the ARH and NTS (for cell number and cell fate specification) and through the pml and mpd parts of the PVH (for axonal projections). The average number of cells and density of fibers were analyzed in 2 – 4 hemisections.
For the quantitative analysis of cell number, four categories of labeled cells were manually counted using Image J software: (1) numbers of POMC+ cells; (2) numbers of Pomc-tdTomato+ cells; (3) numbers of NPY+ cells; and (4) numbers of Pomc-tdTomato + Npy hrGFP double-labeled cells. Only cells with corresponding bis-benzamide-stained nucleus were included in our counts.
Quantitative analysis of fiber density was performed using Image J analysis software (NIH) as described (Bouret et al., 2008; Coupé et al., 2012). Each image plane was binarized to isolate labeled fibers from the background and to compensate for differences in fluorescence intensity. The integrated intensity was then calculated for each image as previously described. This procedure was conducted for each image plane in the stack, and the values for all of the image planes in a stack were summed. Three categories of labeled fibers were quantified: (1) relative density of β-endorphin+ fibers; (2) relative density of α-MSH+ fibers; (3) relative density of NPY+ fibers.
Physiological measures
Request a detailed protocolMale and female mice (n = 7 – 9 per group) were weighed every 2 days from P4 to P21 (weaning) and weekly from 4 to 15 weeks using an analytical balance. To measure food consumption, 13-week-old mice (n = 5 – 7 per group) were housed individually in cages, and, after 1 day of acclimation, food intake was measured every 12 hr for 3 days from pre-weighed portions of food dispensed from the wire cage tops. The cumulative food intake of each mouse (9- and 16-week-old mice; n = 5 – 6 per group) was used for statistical comparisons. Body composition analysis (fat/lean mass) was performed in 16-week-old mice (n = 4 per group) using NMR (Echo MRI). Perigonadal fat depots were collected in 15-week-old mice (n = 4 – 5 per group) and weighed. Respiratory exchange ratio (RER), energy expenditure and locomotor activity was monitored at 15 weeks of age using a combined indirect calorimetry system (TSE systems). Briefly, after adaptation for 1 week, O2 and CO2 production was measured for 4 days to determine the RER and energy expenditure (n = 4 – 6 per group) on composition-matched mice. Glucose tolerance test (GTT) was conducted in 10- to 11-week-old mice (n = 7 – 9 per group) through i.p. injection of glucose (1.5 mg/g body weight) after overnight fasting. Blood glucose levels were measured at 0, 15, 30, 45, 60, 90, 120, and 150 min post-injection. Leptin sensitivity tests were performed in 12- to −13 week-old male mice (n = 5 per group). Briefly, mice were injected i.p. with vehicle (5 mM sodium citrate buffer) or leptin (3 mg/kg body weight, Peprotech) according to the following scheme: vehicle injections for 3 days, followed by leptin injections for 3 days. Body weight was measured during the injection period. Serum leptin and insulin levels were assayed at 15 and 20 – 23 weeks of age (n = 5 – 6 per group) using leptin and insulin ELISA kits, respectively (Millipore).
Statistical analysis
Request a detailed protocolAll values were represented as the mean ±SEM. Statistical analyses were conducted using GraphPad Prism (version 5.0a). For each experiment, slides were numerically coded to obscure the treatment group. Statistical significance was determined using unpaired 2-tailed Student’s t test, 1-way ANOVA followed by Tukey post hoc test, 2-way ANOVA followed by the Bonferroni post hoc test, and linear regression when appropriate. p≤0.05 was considered statistically significant.
Data availability
All data generated or analysed during this study are included in the manuscript and supporting files.
References
-
miR-107 orchestrates ER stress induction and lipid accumulation by post-transcriptional regulation of fatty acid synthase in hepatocytesBiochimica et Biophysica Acta (BBA) - Gene Regulatory Mechanisms 1839:334–343.https://doi.org/10.1016/j.bbagrm.2014.02.009
-
Studies on the physiological functions of the melanocortin systemEndocrine Reviews 27:736–749.https://doi.org/10.1210/er.2006-0034
-
MicroRNAs in brain development and physiologyCurrent Opinion in Neurobiology 19:461–470.https://doi.org/10.1016/j.conb.2009.09.006
-
Development of the hypothalamic melanocortin systemFrontiers in Endocrinology 4:38.https://doi.org/10.3389/fendo.2013.00038
-
Dicer inactivation leads to progressive functional and structural degeneration of the mouse retinaJournal of Neuroscience 28:4878–4887.https://doi.org/10.1523/JNEUROSCI.0828-08.2008
-
MicroRNAs as regulators of metabolic disease: pathophysiologic significance and emerging role as biomarkers and therapeuticsInternational Journal of Obesity 40:88–101.https://doi.org/10.1038/ijo.2015.170
-
MicroRNA: basic mechanisms and transcriptional regulatory networks for cell fate determinationCardiovascular Research 79:553–561.https://doi.org/10.1093/cvr/cvn151
-
Embryonic birthdate of hypothalamic leptin-activated neurons in miceEndocrinology 153:3657–3667.https://doi.org/10.1210/en.2012-1328
-
MicroRNA knock down by cholesterol-conjugated antisense oligos in mouse organ cultureMethods in Molecular Biology 732:89–97.https://doi.org/10.1007/978-1-61779-083-6_7
-
Identification of tissue-specific microRNAs from mouseCurrent Biology 12:735–739.https://doi.org/10.1016/S0960-9822(02)00809-6
-
Efferent projections of neuropeptide Y-expressing neurons of the dorsomedial hypothalamus in chronic hyperphagic modelsJournal of Comparative Neurology 521:1891–1914.https://doi.org/10.1002/cne.23265
-
Down-regulation of miRNAs in the brain and development of diet-induced obesityInternational Journal of Developmental Neuroscience 64:2–7.https://doi.org/10.1016/j.ijdevneu.2017.06.005
-
Development of the neuroendocrine hypothalamusFrontiers in Neuroendocrinology 23:257–291.https://doi.org/10.1016/S0091-3022(02)00003-1
-
microRNAs in the regulation of adipogenesis and obesityCurrent Molecular Medicine 11:304–316.https://doi.org/10.2174/156652411795677990
-
Mash1 is required for generic and subtype differentiation of hypothalamic neuroendocrine cellsMolecular Endocrinology 20:1623–1632.https://doi.org/10.1210/me.2005-0518
-
Developmental programming of hypothalamic neuroendocrine systemsFrontiers in Neuroendocrinology 39:52–58.https://doi.org/10.1016/j.yfrne.2015.09.002
-
Fertility-regulating Kiss1 neurons arise from hypothalamic POMC-expressing progenitorsJournal of Neuroscience 35:5549–5556.https://doi.org/10.1523/JNEUROSCI.3614-14.2015
-
Perinatal programming of metabolic diseases: role of insulin in the development of hypothalamic neurocircuitsEndocrinology and Metabolism Clinics of North America 42:149–164.https://doi.org/10.1016/j.ecl.2012.10.002
-
Neonatal ghrelin programs development of hypothalamic feeding circuitsJournal of Clinical Investigation 125:846–858.https://doi.org/10.1172/JCI73688
-
Small non-coding RNAs in animal developmentNature Reviews Molecular Cell Biology 9:219–230.https://doi.org/10.1038/nrm2347
-
DICER1 is essential for survival of postmitotic rod photoreceptor cells in miceThe FASEB Journal 28:3780–3791.https://doi.org/10.1096/fj.14-254292
-
Hypothalamic miR-103 protects from hyperphagic obesity in miceJournal of Neuroscience 34:10659–10674.https://doi.org/10.1523/JNEUROSCI.4251-13.2014
-
MicroRNA pathways in neural development and plasticityCurrent Opinion in Neurobiology 20:457–465.https://doi.org/10.1016/j.conb.2010.04.002
-
Dicer is required for survival of differentiating neural crest cellsDevelopmental Biology 340:459–467.https://doi.org/10.1016/j.ydbio.2010.01.039
Article and author information
Author details
Sebastien G Bouret

Funding
National Institute of Diabetes and Digestive and Kidney Diseases (DK84142)
- Sebastien G Bouret
National Institute of Diabetes and Digestive and Kidney Diseases (DK102780)
- Sebastien G Bouret
National Institute of Diabetes and Digestive and Kidney Diseases (DK118401)
- Sebastien G Bouret
The funders had no role in study design, data collection and interpretation, or the decision to submit the work for publication.
Acknowledgements
We thank the CHLA Rodent Metabolic Core for metabolic studies and the CHLA Genomic Core for cell sorting and microarray studies. We are also grateful to Gricelda Vasquez with her assistance with animal husbandry. This work was supported by the National Institutes of Health (Grants DK84142, DK102780, and DK118401 to SGB).
Ethics
Animal experimentation: CHLA IACUC protocol #303-16
Version history
- Received: July 24, 2018
- Accepted: October 11, 2018
- Accepted Manuscript published: October 12, 2018 (version 1)
- Version of Record published: October 26, 2018 (version 2)
Copyright
© 2018, Croizier et al.
This article is distributed under the terms of the Creative Commons Attribution License, which permits unrestricted use and redistribution provided that the original author and source are credited.
Metrics
-
- 1,683
- views
-
- 272
- downloads
-
- 23
- citations
Views, downloads and citations are aggregated across all versions of this paper published by eLife.
Download links
A two-part list of links to download the article, or parts of the article, in various formats.
Downloads (link to download the article as PDF)
Open citations (links to open the citations from this article in various online reference manager services)
Cite this article (links to download the citations from this article in formats compatible with various reference manager tools)
Central Dicer-miR-103/107 controls developmental switch of POMC progenitors into NPY neurons and impacts glucose homeostasis
eLife 7:e40429.
https://doi.org/10.7554/eLife.40429
Further reading
-
- Genetics and Genomics
- Neuroscience
Genome-wide association studies have revealed >270 loci associated with schizophrenia risk, yet these genetic factors do not seem to be sufficient to fully explain the molecular determinants behind this psychiatric condition. Epigenetic marks such as post-translational histone modifications remain largely plastic during development and adulthood, allowing a dynamic impact of environmental factors, including antipsychotic medications, on access to genes and regulatory elements. However, few studies so far have profiled cell-specific genome-wide histone modifications in postmortem brain samples from schizophrenia subjects, or the effect of antipsychotic treatment on such epigenetic marks. Here, we conducted ChIP-seq analyses focusing on histone marks indicative of active enhancers (H3K27ac) and active promoters (H3K4me3), alongside RNA-seq, using frontal cortex samples from antipsychotic-free (AF) and antipsychotic-treated (AT) individuals with schizophrenia, as well as individually matched controls (n=58). Schizophrenia subjects exhibited thousands of neuronal and non-neuronal epigenetic differences at regions that included several susceptibility genetic loci, such as NRG1, DISC1, and DRD3. By analyzing the AF and AT cohorts separately, we identified schizophrenia-associated alterations in specific transcription factors, their regulatees, and epigenomic and transcriptomic features that were reversed by antipsychotic treatment; as well as those that represented a consequence of antipsychotic medication rather than a hallmark of schizophrenia in postmortem human brain samples. Notably, we also found that the effect of age on epigenomic landscapes was more pronounced in frontal cortex of AT-schizophrenics, as compared to AF-schizophrenics and controls. Together, these data provide important evidence of epigenetic alterations in the frontal cortex of individuals with schizophrenia, and remark for the first time on the impact of age and antipsychotic treatment on chromatin organization.
-
- Neuroscience
Combining information from multiple senses is essential to object recognition, core to the ability to learn concepts, make new inferences, and generalize across distinct entities. Yet how the mind combines sensory input into coherent crossmodal representations - the crossmodal binding problem - remains poorly understood. Here, we applied multi-echo fMRI across a four-day paradigm, in which participants learned 3-dimensional crossmodal representations created from well-characterized unimodal visual shape and sound features. Our novel paradigm decoupled the learned crossmodal object representations from their baseline unimodal shapes and sounds, thus allowing us to track the emergence of crossmodal object representations as they were learned by healthy adults. Critically, we found that two anterior temporal lobe structures - temporal pole and perirhinal cortex - differentiated learned from non-learned crossmodal objects, even when controlling for the unimodal features that composed those objects. These results provide evidence for integrated crossmodal object representations in the anterior temporal lobes that were different from the representations for the unimodal features. Furthermore, we found that perirhinal cortex representations were by default biased towards visual shape, but this initial visual bias was attenuated by crossmodal learning. Thus, crossmodal learning transformed perirhinal representations such that they were no longer predominantly grounded in the visual modality, which may be a mechanism by which object concepts gain their abstraction.


